Economic Charts

All economic charts are at the bottom of the page.

Saturday, January 22, 2011

Weekly King World News Interviews

This week King World News interviews Rick Santelli, Jim Rickards & John Hathaway.  As always the KWN interviews prove very valuable in gaining further insight into what is going on in our markets and economy.


Rick Santelli - Discusses austerity and its effects on the markets.  He also talks about the banking crisis and how we are putting band-aids on the issues facing the banks and economies, which are not helping much.  Rick answers Jim Rickards question of where Japan got the money to buy bonds from Portugal to help Portugal out of their mess, especially when Japan's debt-to-gdp is the highest in the world.  Rick talks about how gold is not so correlated with inflation anymore and that it is really more of a economic safe haven (as opposed to inflation hedge) and may go higher later.

Jim Rickards - Discusses Alan Greenspan talking about possibly going back to a gold standards.  Jim says the American people should be included in a public debate to talk about moving to a gold standard to create monetary stability.  Jim says inflation is theft from the poor by the rich, as the rich can afford to protect themselves against inflation.  Jim discusses the world economic forum's idea of generating $100 trillion dollars to support global growth.

John Hathaway - Discusses gold consolidation and that the things that are driving gold are still in place and that long term gold will do well.  John also talks about endless QE to keep this market and liquidity up.  John thinks that jobs and the economy will remain week which will perpetuate the QE.  John says the selling in gold and silver is mainly in the paper gold/silver market effecting the prices, but physical gold demand still remains.

Jim Rickards on China

Friday, January 21, 2011

FED POMO Purchase

The FED performed another POMO (Permanent Open Market Operation) purchase today in the amount of $8.36 billion dollars.  This brings the total since November 3rd 2010 (when the FED announced the printing of $600/900 billion dollars by June 2011) to $252.333 billion dollars and $316.793 billion dollars since August 17th 2010.


OPERATION 1 - RESULTS
Operation Date:01/21/2011
Operation Type:Outright Coupon Purchase
Release Time:10:15 AM
Close Time:11:00 AM
Settlement Date:01/24/2011
Maturity/Call Date Range:02/15/2018 - 11/15/2020
Total Par Amt Accepted (mlns) :$8,360
Total Par Amt Submitted (mlns) :$18,959

Thursday, January 20, 2011

December Existing Home Sales

The December Existing Home Sales report was released today with up beat news in existing home sales.  Existing home sales measures the annualized number of residential buildings that were sold during the previous month, excluding new construction. It is considered a leading indicator as it has ripple effects in the economy (mainly in the financial sector). The forecast number called for 4.88M, but the actual headline number was 5.28M. This number not only beat the forecast, but it also beat Novembers 4.7M.

FED POMO Purchase

The FED performed another POMO (Permanent Open Market Operation) purchase in the amount of $2.2 billion dollars.  This brings the total since November 3rd 2010 (when the FED announced the printing of $600/900 billion dollars by June 2011) is $243.973 billion dollars and since August 17th 2010 the total is $308.443 billion dollars.


OPERATION 1 - RESULTS
Operation Date:01/20/2011
Operation Type:Outright Coupon Purchase
Release Time:10:15 AM
Close Time:11:00 AM
Settlement Date:01/21/2011
Maturity/Call Date Range:08/15/2028 - 11/15/2040
Total Par Amt Accepted (mlns) :$2,200
Total Par Amt Submitted (mlns) :$8,169

Weekly Initial Unemployment Claims

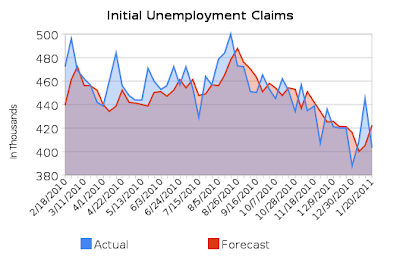
The weekly initial unemployment claims were released today and it seems initial claims is on a roller coaster.  Initial Claims is a number of people that applied for unemployment insurance for the first time in the prior week.  The forecast called for 422k, but the actual headline numbers came in at 404k.  The big shocker was in revisions to last weeks number, which was revised from 445k to 441k.  This is a downward revision which has not happened in the prior year.


Wednesday, January 19, 2011

Weekly Fund Flows

This weeks fund flow report showed continued outflows on municipal bonds and a strong reversal in domestic selling.  Domestic stocks had in-flows of $3.765 billion dollars, Foreign stock in-flows at $2.775 billion dollars.  Taxable bonds had in-flows of $1.388 billion dollars and municipal bonds out-flows of -$2.368 billion dollars.  This out-flow in municipals, is going to compound the problem in municipals.

There seems to be a lot of volatility in the domestic flows shows a lot of uncertainty in the markets.  Domestic stocks showed outflows for months and this is the first significant sign of a reversal.  Next weeks flows in domestic stocks should be telling of volatility.


FED POMO Purchase

The FED performed another POMO (Permanent Open Market Operation) purchase today in the amount of $7.716 billion dollars.  This brings the total since November 3rd 2010 (when the FED announced the printing of $600/900 billion dollars by June 2010) to $241.773 billion dollars and $306.223 billion since August 17th 2010.


Operation 1 - RESULTS
Operation Date:01/19/2011
Operation Type:Outright Coupon Purchase
Release Time:10:15 AM
Close Time:11:00 AM
Settlement Date:01/20/2011
Maturity/Call Date Range:07/31/2013 - 12/31/2014
Total Par Amt Accepted (mlns) :$7,716
Total Par Amt Submitted (mlns) :$39,060

Tuesday, January 18, 2011

FED POMO Purchase

The FED performed another POMO (Permanent Open Market Operation) purchase to the tune of $1.74 billion dollars, bringing the total since November 3rd 2010 (when the FED announced the printing of $600/900 billion dollars by June 2010) to $234.057 billion dollars.  The total since August 17th 2010 is now at $298.517 billion dollars.

OPERATION 1 - RESULTS
Operation Date:01/18/2011
Operation Type:Outright TIPS Purchase
Release Time:10:15 AM
Close Time:11:00 AM
Settlement Date:01/19/2011
Maturity/Call Date Range:04/15/2013 - 02/15/2040
Total Par Amt Accepted (mlns) :$1,740
Total Par Amt Submitted (mlns) :$4,939

Sunday, January 16, 2011

Weekly Unofficial Problem Bank List

CalculatedRisk updated the Unofficial Problem Bank List this week with 933 institutions in trouble.  There were two additions and one removal from the problem bank list.  The one removal was due to the failure of Oglethorpe Bank in Brunswick GA.  The 933 institutions have assets of $410.4 billion dollars at risk.  [ Read more... ]

To see how your bank rates check out www. thestreet.coms bank-safety page and click search for a rating by Weiss Ratings.

Monthly Retails Sales

Decembers Retail Sales numbers were a disappointment compared to what was forecast.  The Retails Sales number is a measure of change in the total value of sales at the retail level.  The Core Retail Sales number is a the same as Retail Sales excluding automobiles.  Retail sales is considered to be a way to gauge consumer spending.  Decembers Retail Sales forecast called for 0.8%, but the actual headline number came in at 0.6%.  When removing Auto's from the picture (Core Retails Sales) the forecast number called for 0.7% change, but the actual headline number was 0.5%.  The graph below shows you where we fell off in terms of numbers in 2007/2008 time frame and then recovered in 2010.

I think the following graph is really telling which is the YOY change in retail sales.  Look how the change year over year in 2008 to 2009 too a dip which wasn't seen in the crash in 2000.  Sure 2000 saw a dip, but none like what we saw in 2008/2009.  It will be very interesting to see where we go from here.

The following graph shows the month over month changes in retail sales as well.  Notice how Retail Sales peaked in October and then fell from there.  We must watch what the next months bring to us to see how strong retail sales become.

Core Retail Sales numbers are presented in the graph below, remember Core Retail Sales exclude automobile sales.  When auto sales are stripped out we see that December 2010 wasn't that great of a month and for the stores August - November was the strongest (Christmas shopping).  Now that we return to slumping retail sales, we see that our Initial Unemployment claims the past  2 weeks had risen as well.

Weekly M1 and M2 Money Supply

2011 should prove very volatile when it comes to money supply as the number of foreclosures (hence the number of debts erased) will cause M1/M2 to contract, while the Federal Reserves money printing activities will cause it to expand.  This data's rise and fall will make it very hard for persons to discern a monetary that is clearly out of control.  With rumors of QE3 floating about and the current $600 billion printing looking more like it will be $900 billion, this should be a very bumpy ride.


Weekly FDIC Failed Banks

This past week we lost 1 more bank, Oglethorpe Bank in Brunswick GA.  This brings the total for 2011 to 3 banks.  This is a little slower start than last year as by this time last year we had already lost 4 banks.