Tony Robbins the motivational speaker and basically the king of positive thinking has come out on video to warn people of the possibility of things getting worse in the economy. If he is giving a warning, then things must be given bad. Considering his ties to financial experts, you may want to watch his video's. They are in part 1 and part 2 and help educate what you should be looking out for.
Take a look at charts at the bottom of the blog and prior blogs to see where the economy sits and form your own opinion. Another topic that is becoming a hot item and I will look into blogging on is the coming/present pension crisis.
Saturday, August 21, 2010
Friday, August 20, 2010
Crisis in California
The California Supreme court has lifted the temporary block on Governor Schwarzenegger's furlough of state employees while the court reviews the states plan. Three fridays a month most state employees will go on unpaid leave in an effort to close the budget deficit in California. Pay cuts are still on the table and actively pursued by the state as well. In addition the Governor is still pursuing minimum wage for state workers until a budget is passed. [ read more... ]
Euro Falls Again
The Euro fell today to a new low for the month due to dovish talk by the European Central Bank and what seems to be endless lending into the end of the year. Zero hedge broke the story this morning stating that it seems Ben Bernanke's QE lite has caught on in Europe. Below is the chart for the EUR/USD and you can read more on this from Zero Hedge here.


GDP revisions and M2 Money Supply
Goldman Sachs announced that GDP projections revising GDP for the 2H2010, as well as 1Q2011, downward to 1.5%. Goldman says that the rest of 2011 will experience very little growth, projections around 3%. This poses a problem for our country. With GDP slowing, our debt will soon overtake the 100% mark. The reduction of GDP is believed to be due to the withdrawal of stimulus, thus proving that this recovery was false. It will take another infusion of stimulus to change the direction again (but that will add more debt to the U.S. Taxpayers).
 Equally important is a trend reported on zero hedge about the M2 money supply which is growing. As you can see M2 money supply has expanded about 175 billion since last April. For those not familiar with M2, economist look at M2 when looking at the quantity of money in circulation.
 M2 money supply includes M1 (which includes only checkable demand deposits), savings and other time deposits. We watch this to see how much money is being printed into the economy possibly devaluing our currency. M0, M1 and M2 are considered to be our primary money supply components, but do not contain credit. There is a pretty good primer on money supply at this link.


Thursday, August 19, 2010
Initial Claims Jump Worse than Expected
Todays initial claims number was much worse than forecasted. The forecasted number 478k and the number this week came in at 500k. Remember initial claims are the number of people who filed for unemployment for the first time last week. The previous numbers were 488k, forecasters must have believed the hype that things were getting better with the forecast of 478k. The chart on the bottom of the blog has been updated and here it is for your convenience.
+(3).png)
+(3).png)
According to BLS here are the states with an increase of more than 1,000
TX +1,071 Layoffs in the service and manufacturing industries.
IL +1,150 Layoffs in the construction, trade, and manufacturing industries.
FL +1,199 Layoffs in the construction, trade, service, and manufacturing industries.
OR +1,268 No comment.
MI +1,347 No comment.
GA +1,458 Layoffs in the construction, trade, service, and manufacturing industries.
PA +1,626 Layoffs in the transportation, industrial machinery, construction, and service industries.
NC +1,895 Layoffs in the construction, service, industrial machinery, computer equipment, electrical equipment, electronic equipment, and textile industries.
IN +1,999 Layoffs in the automobile and manufacturing industries.
CA +4,393 Layoffs in the service industry.
Flight to Safety Benefits Mortgage Holders
This recent flight from stocks into perceived safety in bonds has driven down interest rates recently. Mortgage applications rose 13% last week driven by a 17% surge in applications to refinance. Home loan rates (according to bankrate.com sit at 4.53% for a 30 year and 3.95% for a 15 year. USA today reports that applications to refinance made up 81% of all home loan activity, highest since January 2009. Overall applications for home purchases slowed 3%. Another interesting point found in a prior article from this week was the amount of mortgage holders refinancing into 15 year fixed mortgages (here is another from USA today as well). This is a positive sign as it shows the desire of homeowners to rid themselves of debt sooner. All of this indicates that homeowners are more interested in keeping their home currently than trying to purchase another. I would imagine this won't be good for the housing market. This data is also inline with recent home depot quarterly report which was positive for revenues furthering the argument that mortgage holders are staying put and improving on what they have.
Wednesday, August 18, 2010
Rebuilding America
I've lived long enough to see the benefits and the pitfalls of globalization. It seems finding a balance between the two is a difficult task at best. Globalization opened up new markets for big business to export their goods, increasing profits, thus expanding business. Issues arose when we farmed out jobs overseas for cheaper labor to country's that have an unfair advantage (such as subsidizing industries to keep costs down). It goes beyond this, but simplistically speaking low cost labor and government subsidies helped other nations take U.S. jobs. America's shift from a producing country (industrial and agricultural) to a service oriented country only facilitated the problem of exporting jobs. Instead a prescription of balance should have been on the agenda. Another issue adding insult to injury was the promise of the American dream, an extravagant lifestyle which new no bounds on taking on more debt instead of living within our means.
Small business suffers from trying to obtain credit in an ever increasingly difficult credit market. One could argue, that small business owners lack the capital to create an debt free business further contributing to the problem. So how do we recover? Where do we go from here? For starters I think we need to become a nation of savers again. We need to accumulate capital, so we can afford to start a new business debt free. We need to get back our sense of community, because we will need our community to be successful. We need to find a balance between global growth and local jobs.
Before I go into some depth here, lets lay a little ground work. There are many issues with products imported from overseas for our consumption. Some are safety issues, health issues and so on. Stories in the papers about toys from China containing lead paint, fake eyeballs filled with kerosene and the list goes on. Our food which we mostly imported these days is genetically modified, filled with pesticides and processed increasing risks to our health (which btw increases costs of our healthcare). Cosmetics made with chemicals that almost nobody knows what they are (see cosmetics database for safe soaps and cosmetics or to assess the product of your choices toxicity levels) and side effects that we see later on. Prescription drugs which have more side effects than they do cures are being recalled at an alarming pace (read here).
With these issues in the products that we import, why not create safe products here in the U.S. made by U.S. workers. It will take a mind shift for most Americans as the imported products will most likely remain cheaper, but if we can get safe/organic/non-toxic products produced in America which will be better for your health, isn't that worth the extra money. Here is where community comes in. If communities created small businesses to take care of local needs like agriculture, services and products that provided an advantage to buying local (like using a local currency which brings down the cost of local goods and services, we could start putting firm footing on regaining our footing. Local currency would ensure the money was spent locally, thereby ensuring a customer base for the businesses. Now a local currency obviously is used purely for local incentive, regular dollars will have to be used for outside purchases and other needs in the community (again, balance). Local currencies are being used all over the country currently to fill this very need. This may seem like an insurmountable task and I confess I have to investigate how to implement local currencies legally, the marketing and etc, but all we need is a small step. One step could be supporting our local farmer by joining a co-op. Then one-by-one businesses can be created to fill other needs. This sounds very simplistic and I agree with where our sense of community is today, could be a challenge, but not insurmountable.
I have a feeling whether we do this today or not, we will have to migrate to this way of doing things down the road ensuring real growth and stability in the communities we live in. This false pumping of dollars into the economy to keep it propped up is the equivalent of putting more wooden supports under a structure that adds weight to itself faster and faster, soon enough those supports will give way. As Peter Schiff who forecasted the coming recession/depression in 2006 said "America needs to become producers again".
FY11 State Budget Shortfalls Update
I decided to break down the debt per adult in each state to do a comparison to see which state is in the worst shape in terms of potential taxes paying adults. Unemployment was not figured into the graphed results, but in most cases only resulted in adding another 40 to 120 to the figure. Also, not figured in are persons working, but not collecting a check (hence not paying taxes), this includes volunteers, stay at home spouses taking care of children and etc. If I could find data on the number employed per state and recalculate based income tax payers, the amount per working adult would increase per state. This data does not take into account state revenues from sales tax and such either.
_using_2009_census_data.png)

_using_2009_census_data.png)
Now contrast this with the total budget gap per state. Again, Oregon data not included as they are on a 2 year budget cycle and I didn't have an accurate breakdown over a year.

Notice how Illinois and New Jersey are the largest in both graphs. This could spell trouble for those states as their ability to pay FY11 only's budget gap may be too much per working taxpayer.
State Bailout Money Being Held for Future
As the federal bailout money is being distributed to the states to keep teachers employed, some states are reassessing their situation. Instead of hiring back the teachers they laid off, they are analyzing their budget deficits for next year and using the money to prevent further layoffs. The Los Angeles Unified school district in fact, may still have to layoff thousands of teachers even with the bailout money. Now from prior research and a prior posting, some of this money was to be used for retention of Police and Fire employees as well. This leads me to wonder if any of that money is going to make it to retain emergency services. The money was to be used on current school year, but as with any government mandate has loopholes that carry them through to 2012. This deserves more follow-up to find out if any money went toward emergency personnel retention like it was so highly touted. [ Read more... ]
Harvard Endowment Divests all of its Israeli Holdings
Numerous articles have come out over the past few days about how the Harvard Endowment has divested itself from Israeli holdings. Stories range from most of its holdings to all of its holdings (although more support on the side of all). Other stories report that they divested because Israel is no longer an emerging market and that is what the portfolio was investing in. Conspiracy theorists believe that it is because Israel is close to a conflict with Iran which could cause their markets to tumble. Harvard's 13-F only showed 41million dollars invested, which is only a fraction of the endowments holdings. The red flag got raised due to the speed at which a full divestiture was done. It should be very interesting to see what unfolds over the next few weeks, if anything.
Tuesday, August 17, 2010
State Budget Deficit Shortfalls
I ran across a very interesting report from the Center on Budget and Policy Priorities that shows the past, current and future budget shortfalls for the individual states that make up the U.S. If you want to see what kind of shape your state is in you can take a look at the full article plus data by clicking here. Summation provided for your benefit. In Figure 1 you can see that 46 states have budget short falls in fiscal year 2010.
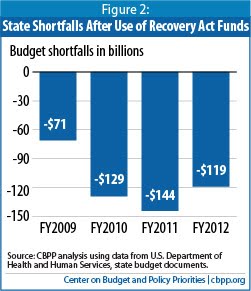
 Projected budget shortfalls of all the states combined can be viewed in figure 2. The report takes a positive view on FY 2012 saying that if employment picks up then -$119 billion would be the shortfall. If employment continues to be a laggard or a new crisis (more of the same) erupts these figures could change. This chart also takes in consideration the 40 billion of recovery act dollars.


Below is a graph showing which states have the largest budget deficits. One thing to keep in mind when looking at this graph is, a per capita analysis needs to be done to see who is in the worse shape (Coming up).

Oregon does a 2 year budget, so its data is not reflected here.
World Economic Condition Summed Up
I saw these two videos posted on the Market Ticker and wanted to ensure everybody got the benefit from them. Kyle Bass seems to have a good grasp on the fact that we are going to need a global restructuring. The other two from CNBC don't seem to really get it. Also interesting are the statements Kyle makes about bonds.
The second video is really enlightening about the stress tests done by the European banks. Seems like the European Union really has their eyes closed on this roller coaster or more likely trying to keep a lid on things and try to take care of them under the covers so the Euro doesn't take another big hit.
The second video is really enlightening about the stress tests done by the European banks. Seems like the European Union really has their eyes closed on this roller coaster or more likely trying to keep a lid on things and try to take care of them under the covers so the Euro doesn't take another big hit.
Is Government becoming a mortgage house?
With the nationalization of Fannie Mae and Freddie Mac and more than $148 billion being pumped into bailing them out, the question of whether the Government should continue its big stake in the housing market has been raised. Fannie and Freddie are projected to continue to take on more and more mortgages that will default and will need additional money to bail them out. The cap of 400 Billion for bailing out Fannie and Freddie has been lifted (the skies the limit). Proponents of Government backing of the housing market say that if we were to give it back to the private sector interest rates would soar (Mainly due to risk). The one thing we have to remember though, the government backstopping of these mortgages and their failures fall on our bill. Even though the check has been delayed from coming due (because of elections and such) doesn't mean it won't. That bill has to be paid and each mortgage that gets financed, backed and fails is going to get paid by each and every one of us. We are not doing ourselves any favors trying to prop up a market that gets heavier and heavier every day. [ Read more... ]
Today's Economic News
New Building permits were down from a forecast of 58M to 57M showing a slowdown in future construction. PPI (Producer price index), which is the change in price of finished goods and services sold by producers met forecast of 2%, but exceeded last months figure of -.5%. The PPI is a leading indicator of consumer inflation. If the costs to produce a finished good or service increases that increase will be passed on to the consumer leading to inflation. Housing starts was down from a forecast of 57M to 55M, but beat the previous months number of 54M. Housing starts are considered a leading indicator because they are supposed to create jobs. Overall the housing starts number is flat to down when you look at the past year. Home Depot announced a better quarter with profits up 6.8%, which could be contributed to more people deciding to improve their home instead of shopping around for another. Walmart profit rises 3.6%, which can be attributed to more people trying to save money in their purchases.
Monday, August 16, 2010
July 2010 Spending
Videos from SpendingPulse sums up spending better than I can. SpendingPulse is a service from Mastercard advisors.
July 2010 Industries Report
July 2010 Total U.S. Retail Sales Report
July 2010 Industries Report
Japanese Economy Slows Unexpectedly
Japanese exports slowed considerably and consumers in Japan reigned in spending. Reduced exports and personal consumption caused GDP figures to shrink (seasonally adjusted) to 0.4% instead of the revised 4.4% in the first quarter and 2.3 in the last quarter. This is most likely due to the strength in the Japanese Yen vs. the U.S. Dollar. The chart below shows how the US Dollar has decreased in strength vs the Yen. 

The opposite effect seems to be hitting Germany the weaker euro has significantly increased exports for them. [ read more.. ]
China Becoming Number 2 Economy
CNNMoney put out a piece today called "China marches towards world's no. 2 economy", which shows how China will eclipse Japan in GDP, by the end of 2010, placing them in the number 2 economy in the world.
Sunday, August 15, 2010
Is this Finally the Economic Collapse
In an article entitled "Is this Finally the Economic Collapse" posted on money.cnn.com by Keith R. McCullough really does a good job in summing up were we sit in the economy today and foreshadows the future with QE2 (Quatatative Easing part 2). To further support Keith's article I will provide supporting data to some key points made and try to break them down a bit from my own research. Keith states that the crossing of 90% for the Debt to GDP ratio is the point of no return for the U.S. economy ( and we are beyond 90%).
 Observe that in the 1940's we did have a Debt-to-GDP of 120% and we obviously came back from that. So why is that different? How if we came back from 120% percent Debt-to-GDP if 90% Debt-to-GDP today is a point of no return. In 1946 our debt climbed to $279 billion (due to World War II accumulated debt) and never actually went down as you can see in the chart below which I changed to be debt in billions of dollars (i.e. we didn't pay it down).


.png)


Now if we look at how much GDP has grown we can observe how we came down from 120% in the 40's.

Overlaying GDP growth and Debt growth together between 1930 to 1970 reveals a very interesting development. We didn't actually pay off all of our debt (actually we increased it), we just increased GDP more than our debt. You can actually see the crossover of Debt and GDP.
.png)
The next question is why don't we just do the same thing again to solve our current debt crisis or wait over time and GDP will increase. A couple of issues come into play with that scenario. First in the mid to late 1980's we started shifting our economy from a industrial to a service economy. We now import most of our goods from other nations instead of creating them. Even products our U.S. based companies get created or are mostly made from parts made overseas. In this past decade we started shipping our service oriented jobs overseas as well. Our ability to increase real GDP growth is greatly reduced. The other issue is that we have consumed too much and created too much debt which continues to climb. Interest on that debt starts to feed into that debt as our ability to pay debt, with Government revenues, exceeds Government revenues. As of this writing the interest per citizen is $3,407.00, according the the U.S. Debt clock. Now remember that was per citizen, not tax paying or employed citizens.
Another fact that doesn't bode well for our economy is demand for products from China (one of the main financiers of U.S. Debt) had decreased. Last year imports decreased 12.3 percent from the U.S. to China. Recent articles depict a further reduction in imports from China as the Chinese economy is slowing (China-US trade chart courtesy of uschina.org).

Another fact that doesn't bode well for our economy is demand for products from China (one of the main financiers of U.S. Debt) had decreased. Last year imports decreased 12.3 percent from the U.S. to China. Recent articles depict a further reduction in imports from China as the Chinese economy is slowing (China-US trade chart courtesy of uschina.org).

Using July 2010's U.S. workforce figure of 153,560,000 and the current food stamp figure of 41,720,812 from the US Debt Clock, we come up with 27% of the work force is on food stamps. The workforce includes employed and unemployed people, they are the people eligible to work.
Keith mentions the yield spread in his article and the fact that it continues to collapse, down another 4 basis points. What is the yield spread you might ask, well the yield spread (or yield curve spread) is the difference between short-term and long-term interest rates. In the past, a narrowing or flattening of the spread indicates a slower economic growth or increased pressure on bank earnings. Another note interesting about the yield curve is that when it gets inverted (short-term rates exceed long-term rates) a recession usually ensues within 2 years.
Here is a chart of the S&P 500 to illustrate what Keith was talking about it falling under its 200 day moving average, but first lets talk about what this is. The S&P 500 is an index that is composed of 500 large-cap common stocks actively traded in the U.S. This index gets companies changed out from time to time and can give indicators of how large-cap companies are doing. The 200 day moving average is a average of the stock price over a moving window of 200 days. Generally, if the index stays above its moving average that indicates growth. When the index falls below its 200 day moving average it indicates slowing of these large-cap companies and a possible critical turning point (not always guaranteed as injections/interference from the government skews results). Chart courtesy of yahoo finance.
 The U.S. Volatility Index or VIX indicates the amount of volatility in the market. When the VIX rises the difference between the high and low prices for the indices start to widen. You'll notice large swings in price movement while the VIX is on the rise and a smaller price movement when the VIX is lower.
To end this post, I think the quote Keith made speaks volumes and is worth repeating. "The American Republic will endure until the day Congress discovers that it can bribe the public with the public's money".

To end this post, I think the quote Keith made speaks volumes and is worth repeating. "The American Republic will endure until the day Congress discovers that it can bribe the public with the public's money".
Subscribe to:
Comments (Atom)