I ran across a very interesting report from the
Center on Budget and Policy Priorities that shows the past, current and future budget shortfalls for the individual states that make up the U.S. If you want to see what kind of shape your state is in you can take a look at the full article plus data by clicking
here. Summation provided for your benefit. In Figure 1 you can see that 46 states have budget short falls in fiscal year 2010.
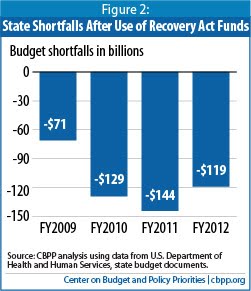
Projected budget shortfalls of all the states combined can be viewed in figure 2. The report takes a positive view on FY 2012 saying that if employment picks up then -$119 billion would be the shortfall. If employment continues to be a laggard or a new crisis (more of the same) erupts these figures could change. This chart also takes in consideration the 40 billion of recovery act dollars.
Below is a graph showing which states have the largest budget deficits. One thing to keep in mind when looking at this graph is, a per capita analysis needs to be done to see who is in the worse shape (Coming up).
Oregon does a 2 year budget, so its data is not reflected here.


No comments:
Post a Comment