CNBC discusses the possibilities of losing the dollar or sharing reserve currency status.
Saturday, March 5, 2011
Gallup Poll Says U.S. Unemployment at 10.3%
The Gallup poll rated unemployment for the month of February 2011 at 10.3% vs the manipulated BLS U3 number of 8.9% the president is claiming as a victory. Again, food stamp recipients at an all time high and the number of actual unemployed people and homeless is rising. I don't know what algorithm Gallup uses to calculate its unemployment and underemployment, but here is the link to see for yourself (click here).

Weekly Money Flows
The Money Flows report for the week of Feb 23rd 2011 (always reports 2 weeks behind) showed the amount of money flowing out of Municipalities had reduced slightly for the first time in a while. Now this could just be a breather or a change in direction, only time will tell. The amount of money flowing out of Municipalities was -$556 million, while Taxable bonds saw $4.449 billion in inflows. Domestic stocks continued to see in-flows, albeit slower, of $1.499 billion, while foreign stocks saw inflows of $1.031 billion dollars.


Friday, March 4, 2011
Monthly Food-Stamp Report Increases
Last month the number of people that are on food-stamps increased by 486,530 to a total of 44,082,324. All but 2 states increased, those 2 states are as follows:
The following states had increases over 20,000:
This should be another economic indicator for most. Ask yourself, if unemployment is getting so much better, how do we increase our food stamp consumption by .5 million each month.

| State | Change |
|---|---|
| KS | -707 |
| KY | -262 |
The following states had increases over 20,000:
| State | Change |
|---|---|
| CA | 48,185 |
| FL | 48,702/td> |
| IL | 70,045 |
| NY | 35,375 |
| OH | 22,970 |
| TX | 30,202 |
| UT | 20,324 |
This should be another economic indicator for most. Ask yourself, if unemployment is getting so much better, how do we increase our food stamp consumption by .5 million each month.

FED POMO Purchases This Week
The FED performed multiple POMO (Permanent Open Market Operation) purchases this week. A POMO purchase involves the FED purchasing bonds from its 12 primary dealers (which they purchased with printed money from the Treasury). The total POMO purchases since November 3rd 2010 (when FED announced the printing of $600/900 billion dollars by June of 2011) to $405.776. The total since August 17th 2010 is $470.236 billion dollars.


Unemployment Rate
The Unemployment rate for February 2011 was released and on the surface looked good coming in at a U3 rate of 8.9%. U3 is calculated by dividing the unemployed by the labor force. This is very simple, but doesn't take into account the number that have dropped out of the labor force. As you can see below U6 which takes into account Marginally attached, Part Time for Economic Reasons and such is actually at 16.8%. Taking into account persons that want a job now but cannot find one and you get real unemployment at 21%.


Now both U3 and U6 still don't include the number of persons that dropped out of the participation rate so we take a look at some BLS (Bureau of Labor Statistics) for additional historical data. The first 2 graphs show The civilian labor force level, which has been sideways to declining as the population has been increasing.


Then we take a look at the number of persons that are not in the labor force, which has been increasing (so more and more people are out of the labor force). Compare that with the civilian labor force participation rate which has been declining in the past decade (in percentage) especially since 2008.


Finally, we look at the unemployment level in the following graph which shows a decline in unemployment (due to persons whom have dropped out of participation in employment). The last graph shows a slight decline in the number of persons unemployed for 27 weeks and over (decline after a spike), need more data to see what the longer term trend is.


To sum up I don't see things improving in the numbers when so many are falling out of the participation rate of unemployment. We need to see real growth in participation rate and a decrease in the number of persons who want a job now, but cannot get one.
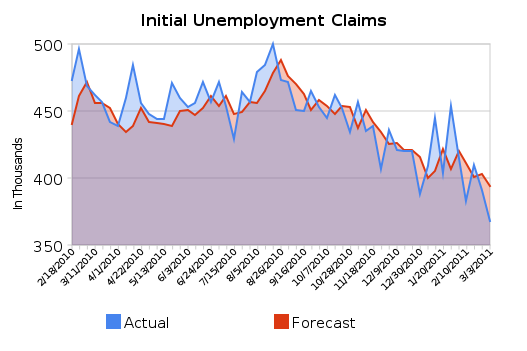
Initial Unemployment Claims
The initial unemployment claims was released Thursday looking better than expected. Initial Unemployment claims measures the number of persons who filed for unemployment for the first time in the previous week. The forecast called for 394k, but the actual headline came in at an improved 368k. The previous weeks number of 391k was revised down to 388k. This brings the 4 week moving average to 388k (unrevised) 410k (revised, but behind one week).


Sunday, February 27, 2011
Weekly Unofficial Problem Bank List
CalculatedRisk released the "Unoffical Problem Bank List" today and reported that it had increased to 960 institutions adding $8.9 billion dollars of assets. This brings the total assets to $413.8 billion dollars due to decreases in assets from removals. This week there were 3 removals and 12 additions to the list. Refer to the article from CacluatedRisk.com for detailed information.


Weekly FDIC Bank Failures
We only lost 1 bank this week bringing the total banks failed in 2011 to 23. This week we lost Valley Community Bank in St. Charles Illinois. Currently we are ahead of the pace set last year with 22 banks lost by this time last year and way ahead of the pace set in 2009 with 16 banks failed by Feb 27th. This could mean that we may on pace to exceed 157 set in 2010.

Weekly M1/M2 Update
This weeks report showed that M1 (containing currency, travelers checks, demand deposits, and other checkable deposits) contracted by -0.46% and M2 (containing M1, plus retail money market mutual funds, savings and small time deposits) increased by 0.09%. In a year over year analysis we see that both M1 and M2 are down from the previous period a year ago. Money supply is the total amount of money in the market at a specific time and if you look at M1 we continue to climb to new highs all the time (some pullbacks). M3 is a better measure of money supply and could be viewed below with the graph that is linked to shadowstats.com.


Updated Housing Permits, Starts, Completions
I decided we needed to get a better view of where the housing picture so I went back into the data to 2005. What you will notice is that at the height of the market in 2006 we saw completions that were above permits and starts, but in 2010 we have moved where completions are under permits and starts. The other data point is that we are are less than 1/4 of the number of permits/starts/completions than from 2006, but their is 7.6 months of inventory on the market is higher then 2006 (where inventory was hard to find) and this inventory is going to grow over he next 2 years. So the question you might ask is if we have so much inventory on the market right now, why add more houses to the market? The answer is that if we didn't these builders would go out of business.


Weekly King World News Interviews
This week KingWorldNews.com interviews Pierre Lassonde, Michael Pento, Jim Rickards and Art Cashin. These interviews cover the political unrest in the Middle East, its effects on the price of oil and gold, the IMF's efforts to displace the dollar as a reserve currency, the FED's continued printing of money (as well as QEIII) and gold/silvers rise.
Pierre Lassonde - Discusses how the German Chancellor and her party were voted out of office and there may be a more bias toward socialism in Germany and the Euro structure will become tenuous causing Greece and others to fall. Pierre expects Gold to go to $1500 on the back of those events. Pierre talks about China and India's current growth and demand for gold. Pierre, then discusses gold, diamonds and mining and mining companies.
Michael Pento - Discusses how Bernanke's raising the estimates for GDP everybody is turning bullish. Michael talks about mortgage rates (which are going up) how the Government borrowing more money is only going to cause interest rates to go higher. US Dollar is getting crushed and has lost 5% since December of 2010 and the US dollar is no longer considered a safe haven for international investors. This will force investors to up their allocations to commodities (especially precious metals). Michael also discusses the geopolitical unrest in the Middle East and is going to cause oil to go much higher. He asks what is going to happen when we try to return to a normal market with interest rates going higher. He believes the end game is the US will default and/or go through restructuring. Michael believes that gold is the way to go and any pull back on gold should be taken advantage of. Michael believes that QE3 is right around the corner and going to be a done deal.
Jim Rickards - Discusses the turmoil in the Middle East and how it is creating opportunity for Al Queda to create additional instability which will cause more issues in the sovereign debt crisis. He points out that oil could go higher due to this unrest, but don't underestimate the ability of government to keep a lid on prices through various ways. Jim talks about he discussion that occurred in Davos where it was pointed out the world needs to re-liquify (with $100 trillion dollars). He asks where that money is going to come from? He points out that the IMF has then followed up with a report using SDR's targeting issuance (global QE) to various countries at $200 billion a year (removing the dollar as a reserve currency). He points out that the IMF wants to create a bond market for the SDR's (and notes) so the international community has investable assets to put money in and that this is a step toward having SDR's become the reserve currency. He believes we are not coming out of discussion of this and moving toward implementation. The SDR is a basket and currently the dollar is a major component and this could be changed at any time by reducing the dollar and brining others in.
Art Cashin - Discusses how the political unrest in the Middle East and has had little effect on the US stock market. Art believes the US stock market is very over extended currently. He recommends to look at advancers/decliners to assess if we are at a top in the stock market. Art says the events in Egypt, Bahrain and Libya should have caused a stampede of a flight to safety in the dollar, but instead went into other things (like US treasuries). Art believes Bahrain is the key to future issues in oil, if things continue to get bad in Bahrain this could cause issues for Saudi Arabia. Saudi Arabia is doing everything they can to cool down the unrest in Bahrain.
Subscribe to:
Posts (Atom)