Saturday, December 25, 2010
Friday, December 24, 2010
Meredith Whitney on the Economy
Meredith explains why people are spending again as they have stopped paying their mortgage and spent on other things now. She also talks about government layoffs which are coming.
Whose Buying Domestic Stocks
Trimtabs cannot find where the money is actually coming from that is flowing into the market as fund flows show massive exodus from Domestic stocks and flowing into foreign stocks (no leaving bonds). Charles Biderman suspects it can only be the government with QE money and asks a question that we all need to consider, what happens when QE ends?
Silver Manipulation
Clearly these two videos were created to drive silver sales, but make very good points in a real situation that is under investigation right now for silver manipulation. Insiders have been reporting to the CFTC when manipulations were going to happen and how (re: gata.org) and nothing has been done to date on it. This story will be very interesting to follow in the coming year. Video number 2 is very interesting.
Thursday, December 23, 2010
Monthly Personal Income/Spending
November's Personal Income, Disposable Income and Personal Spending came out today. All three are pretty self explanatory. These factors (especially spending is very important to the economy as in our current keynesian economy we need to drive spending to ensure growth. Personal income increased $42.3 billion or 0.3% from month to month (percent change down from October). Personal consumption or spending increased $43.3 billion or 0.4% from month to month (down from October in terms of percent change). Real disposable income was flat month over month in terms of percent change (still increased, just at the same rate).

Even though Personal Income, Disposable Income and Spending were all up, Personal Savings decreased showing a willingness to loosen up on the wallet. Personal savings is back on a decline as of November. Of course this make some sense as it is the Christmas spending season and Americans are feeling pent up from saving for the past 2 years. It will be interesting to see the next couple months as the tax extensions were extended to see if spending continues and savings persists its decline.

Percent change from preceding month in 2010
| Category | July | Aug | Sept | Oct | Nov |
|---|---|---|---|---|---|
| Personal income, current dollars | 0.1 | 0.5 | 0.0 | 0.4 | 0.3 |
| Disposable personal income: | |||||
| Current dollars | 0.0 | 0.4 | -0.1 | 0.3 | 0.3 |
| Chained (2005) dollars | -0.2 | 0.3 | -0.2 | 0.2 | 0.2 |
| Personal consumption expenditures: | |||||
| Current dollars | 0.3 | 0.5 | 0.3 | 0.7 | 0.4 |
| Chained (2005) dollars | 0.1 | 0.3 | 0.2 | 0.5 | 0.3 |
November Core/Durable Goods
Today the Core Durable and Durable goods number was released today. Durable goods are the change in the total value of new purchase orders placed with manufacturers for durable goods. Core durable goods is durable goods minus the change in the total value of new purchase orders placed with manufacturers for durable goods, excluding transportation items. The durable goods number was forecasted to be -0.5%, but the actual headline number was -1.3%. When you strip out transportation items from the durable goods number (Core Durable Goods) the headline number was 2.4%, which was better than 1.7% that was forecasted.


Having new orders or a strong order pipeline is important to economic health. The following comments where made with respect to new orders:
New orders for manufactured durable goods in November decreased $2.6 billion or 1.3 percent to $193.7 billion, the U.S. Census Bureau announced today. This decrease, down three of the last four months, followed a 3.1 percent October decrease. Excluding transportation, new orders increased 2.4 percent. Excluding defense, new orders decreased 2.3 percent
Transportation equipment, also down three of the last four months, had the largest decrease, $6.2 billion or 11.9 percent to $45.5 billion. This was due to nondefense aircraft and parts, which decreased $6.6 billion.Additionally, build up of new orders is a bad sign. The following comments were made with respect to inventories:
Inventories of manufactured durable goods in November, up eleven consecutive months, increased $1.9 billion or 0.6 percent to $319.1 billion. This followed a 0.6 percent October increase.
Transportation equipment, also up eleven consecutive months, had the largest increase, $1.1 billion or 1.3 percent to $84.3 billion.
Weekly Initial Unemployment Claims
Last weeks initial unemployment claims were released today. Initial claims are the number of persons who filed for unemployment insurance for the first time in the past week. This is an indicator of economic health as if the number declines week over week it is a sign that employers are hiring or unemployment is slowing down. The forecast called for 421k initial claims, but the actual headline number came in at 420k. If our delta continues to hold up though, this is a disappointment because you need to add 3k to the number. It is too early to tell whether we met or beat the prior weeks number.


Revisions remain relatively steady allowing us to add about 2 to 3k to any headline number that is released.

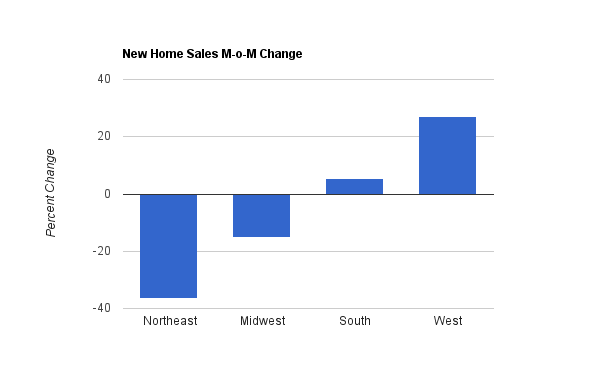
November New Home Sales
The November New Home Sales were released today. New home sales are the annualized number of new single-family homes that were sold during the previous month. It is considered a leading indicator of economic health due to its ripple effect throughout the economy. The forecast called for 301k new home sales, but the actual headline number was 290k. This was better than Octobers adjusted 275k, but did not meet forecasts.

Year over Year on actual houses sold, shows a trend down for all regions of the U.S. The midwest was impacted the hardest in year over year change in number of houses sold.

Month over month changes in New home sales shows the Northeast losing sales and the South and West showed a more positive outlook from October to November.
The supply of New houses for sales decreased from 8.8% in October to 8.2% in November. This is still a larger supply of new houses on the market than a year prior which was 7.7%.
Wednesday, December 22, 2010
Existing Home Sales
Novembers Existing Home Sales numbers were released today with better growth than the previous month, but disappointed vs the forecast. Existing home sales measures the annualized number of residential buildings that were sold during the previous month, excluding new construction. Existing home sales is considered a leading indicator due to its ripple effects it has throughout the economy. The forecast called for 4.72 M, the actual headline number came in at 4.68 M. Yet, the data shows the trend upward since July has resumed, which is positive if you think homes can carry our economy forward again. It is a component and will be a factor in helping the economy, but won't be a driving force.

Lawrence Yun, NAR chief economist made the following comment regarding inventory.
Total housing inventory at the end of November fell 4.0 percent to 3.71 million existing homes available for sale, which represents a 9.5-month supply4 at the current sales pace, down from a 10.5-month supply in October.Ron Phipps, NAR president made the following comments regarding near term buying opportunities.
“Traditionally there are far fewer buyers competing for properties at this time of the year, so serious buyers have a lot of opportunities during the winter months,” he said. “Buyers will enjoy favorable affordability conditions into the new year, although mortgage rates are expected to gradually rise as 2011 progresses.”
Of course interest rates will depend on how the markets react to the FED's efforts in suppressing them, recently they have risen in response. Also, we need to see if banks fall back to the old ways in financing anybody with interest only or variable interest rate mortgages where the mortgage interest reset (rarely understood by consumers) reset and we do this all over again.
Weekly Fund Flows
We had another week of money flowing out of domestic stocks, taxable bonds and municipal bonds. This past week, bonds accelerated their sell off by billions more. With the potential for defaults in the municipal market being talked about, it seems that investors are electing to depart the municipals instead of being a part of a potential free fall. Figure 1 shows the large reversal in bonds from inflows to outflows.

Figure 1.
Domestic funds (shown in figure 2) continue their sell off since I started tracking this and has been selling off billions week for week. Foreign money flows continue on the upside with $2.241 billion of inflows this past week.

Figure 2.
Taxable mutual funds started their sell off the week before, but accelerated its sell off from -$401 million to -$3.766 billion.

Figure 3.
FED POMO Purchase
The FED performed only one POMO (Permanent Open Market Operation) purchase today in the amount of $2.07 billion dollars. This brings the total since August 17th 2010 to $228.413 billion dollars printed and since Nov 3rd (when the FED announced the printing of $600/900 billion by June 2011) to $163.953 billion dollars. To meet the goal of $600 billion by the end of June 2011, the FED now only has to print $72.67 billion per month or $122.67 billion per month to reach $900 billion (assuming no more printing for the year 2010).


OPERATION 1 - RESULTS
| Operation Date: | 12/22/2010 |
| Operation Type: | Outright Coupon Purchase |
| Release Time: | 10:15 AM |
| Close Time: | 11:00 AM |
| Settlement Date: | 12/23/2010 |
| Maturity/Call Date Range: | 02/15/2021 - 11/15/2027 |
| Total Par Amt Accepted (mlns) : | $2,070 |
| Total Par Amt Submitted (mlns) : | $13,055 |
Tuesday, December 21, 2010
FED POMO Purchases
The FED executed 2 POMO (Permanent Open Market Operation) purchases today for a total of $9.409 billion dollars. This brings the total since August 17th 2010 to $226.343 billion dollars and brings the total since November 3rd (when the FED committed to $600/900 billion by June 2011) to $161.883 billion.


| Operation Date: | 12/21/2010 |
| Operation Type: | Outright Coupon Purchase |
| Release Time: | 10:15 AM |
| Close Time: | 11:00 AM |
| Settlement Date: | 12/22/2010 |
| Maturity/Call Date Range: | 06/30/2016 - 11/30/2017 |
| Total Par Amt Accepted (mlns) : | $7,790 |
| Total Par Amt Submitted (mlns) : | $18,224 |
OPERATION 2 - RESULTS
| Operation Date: | 12/21/2010 |
| Operation Type: | Outright TIPS Purchase |
| Release Time: | 1:16 PM |
| Close Time: | 2:00 PM |
| Settlement Date: | 12/22/2010 |
| Maturity/Call Date Range: | 07/15/2012 - 02/15/2040 |
| Total Par Amt Accepted (mlns) : | $1,619 |
| Total Par Amt Submitted (mlns) : | $4,718 |
Monday, December 20, 2010
FED POMO Update
Today the FED executed 2 POMO (Permanent Open Market Operation) purchases, the first in the amount of $7.79 billion and then in the afternoon of $6.779 billion dollars. Combined today's POMO purchase equalled $14.569 billion dollars. This brings the total since August 17th 2010 to $216.934 billion and brings the total since November 3rd (when he announced the printing of $600/900 billion) to $152.454 billion dollars.


| Operation Date: | 12/20/2010 |
| Operation Type: | Outright Coupon Purchase |
| Release Time: | 10:15 AM |
| Close Time: | 11:00 AM |
| Settlement Date: | 12/21/2010 |
| Maturity/Call Date Range: | 02/15/2018 - 11/15/2020 |
| Total Par Amt Accepted (mlns) : | $7,790 |
| Total Par Amt Submitted (mlns) : | $17,215 |
| Operation Date: | 12/20/2010 |
| Operation Type: | Outright Coupon Purchase |
| Release Time: | 1:15 PM |
| Close Time: | 2:00 PM |
| Settlement Date: | 12/21/2010 |
| Maturity/Call Date Range: | 12/31/2014 - 05/31/2016 |
| Total Par Amt Accepted (mlns) : | $6,779 |
| Total Par Amt Submitted (mlns) : | $16,355 |
Sunday, December 19, 2010
Debt of Advanced Economies
The following chart is a nice view of Governmental debt by most of the advanced economies to aid you in your decision processes. It provides a great view of countries having issues in 2010 and how they will fair in 2011.

Weekly KWN Interviews
This week King World News interviews Victor Sparendeo, Ben Davies, Robin Griffiths and Jim Rickards. Discussions range from U.S. money printing, the FED, the EU/European/Euro problems ahead and Gold.
Victor Sparendeo - Discusses where George Soros really thinks gold is going. Victor talks about inflation that is to come down the road and gives a brief history of inflation in the U.S. Victor discusses what George Soros means when he says Gold is in a bubble, which means it is heading for a bubble but is not necessarily in a bubble yet (hence why he is still a buyer).
Ben Davies - Discusses the Soveriegn and Banking crisis in the EU and how that is coming to roost. He discusses how all these fiat currency systems are a giant ponzi scheme and breaks down past issues with various currencies. Ben discusses in detail the Euro and the issues of countries leaving the Euro or staying in the Euro. Ben also discusses the possibilities of the Euro falling around 2012 and put pressure on all other currencies.
Robin Griffiths - Discusses the mass exodus from the bond market that is occurring now. Robin discusses the ties between Germany and Ireland and why they continue to back Ireland, as well as why the European community has a lot of changes down the road to continue to get bailed out. Robin talks about how important China/Asia is for the world and how they have a lot of power in the world currently.
Jim Rickards - Discusses 2010 in an economic review of the year and issues that were incurred in 2010 and prior. Jim also talks about the actions of the FED and the repercussions of its actions. One thing pointed out by Jim is that "Job 1 of the FED is to protect the interests of the banks". Jim points out that the way you help the banks is by creating inflation and that seems to be the FED's main mission. Jim also talks about themes in 2011.
Weekly Unofficial Problem Bank List Update
CalculatedRisk has updated the Unofficial Problem Bank List bringing the total of problem banks to 920 institutions with $411.40 billion in assets.
The Unofficial Problem Bank List finished the week at 920 institutions with assets of $411.4 billion, up from 919 institutions last week. Assets were essentially unchanged. This week there were six failures, but only four were on the list -- The Bank of Miami, National Association, Coral Gables, FL ($448 million); Chestatee State Bank, Dawsonville, GA ($244 million); United Americas Bank, National Association, Atlanta, GA ($242 million); and Appalachian Community Bank, F.S.B., McCaysville, GA ($68 million Ticker: APAB).
As anticipated, the OCC released its actions through mid-November, which contributed to the five additions the weeks. Newly joining the list are Omnibank, National Association, Houston, TX ($384 million); Empire National Bank, Islandia, NY ($319 million Ticker: EMPK); The First National Bank of Mercersburg, Mercersburg, PA ($188 million Ticker: MCBG); The Headland National Bank, Headland, AL ($114 million); and The First National Bank of Fleming, Fleming, CO ($18 million).
The OCC strengthened actions against First Citizens Bank of Polson, National Association, Polson, MT ($26 million) and Metropolitan National Bank, New York, NY ($600 million) by replacing Formal Agreements with Consent Orders. The other change was a Prompt Corrective Action order being issued by the Federal Reserve against The Park Avenue Bank, Valdosta, GA ($1.0 billion).
We anticipate the FDIC will release its actions for November 2010 next week, and it is likely they will take the rest of the year off executing closures.
Weekly Bank Failure Update
This past week bore witness to 6 additional bank failures brining the total to 158 banks failed in 2010 so far. The state of Georgia was hit the worst losing 3 of the 6 banks; United Americas Bank in Atlanta, Appalachian Community Bank in McCaysville and Chestatee State Bank in Dawsonville. The other banks that failed were; Community National Bank in Lino Lakes MN, First Southern Bank in Batesville AZ and The Bank of Miami in Coral Gables FL.


Subscribe to:
Posts (Atom)