The November New Home Sales were released today. New home sales are the annualized number of new single-family homes that were sold during the previous month. It is considered a leading indicator of economic health due to its ripple effect throughout the economy. The forecast called for 301k new home sales, but the actual headline number was 290k. This was better than Octobers adjusted 275k, but did not meet forecasts.

Year over Year on actual houses sold, shows a trend down for all regions of the U.S. The midwest was impacted the hardest in year over year change in number of houses sold.

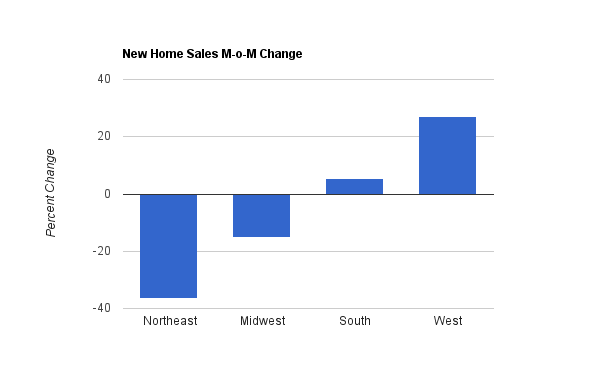
Month over month changes in New home sales shows the Northeast losing sales and the South and West showed a more positive outlook from October to November.
The supply of New houses for sales decreased from 8.8% in October to 8.2% in November. This is still a larger supply of new houses on the market than a year prior which was 7.7%.
No comments:
Post a Comment