Octobers New Home Sales numbers were worse than expected. New Home Sales are the Annualized number of new single-family homes that were sold during the previous month. They are considered a leading indicator of economic health because of the ripple effects in jobs it has throughout the economy. The forecast called for October to have at least 311k new homes sales, but the actual headline number came in at a disappointing 283k ( disappointing to Keynesian's, as we have to build new things all the time to sustain the current growth model. Everlasting growth, cause the earths space is infinite).

Month over Month shows that the West is doing the worse in terms of growth, followed quickly by the Midwest. The Northeast did not perform well over the past month as well.

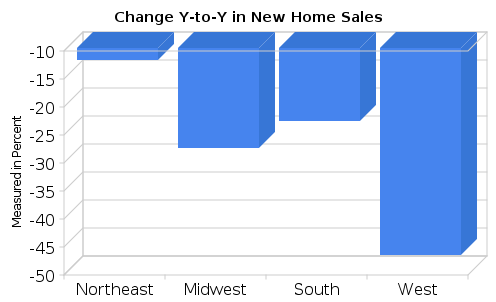
Year over Year New home sales were horrible for the West with the Northeast doing the best. Year over year is a better measurement as it lines up seasonalities and tends to project a more accurate picture.
No comments:
Post a Comment